Start with a clear live device overview
The main device dashboard is designed for quick scanning. Search and type filters help narrow a larger device list, while online status, battery state, solar input, and power readings make unusual conditions easier to spot.
Grid and list layouts serve different screen sizes and monitoring styles. Sort options for name, AC input, AC output, and solar input help bring the most relevant devices to the top without changing their underlying data.
- Search devices and device notes from one overview.
- Filter tested device families and review online or offline status.
- Sort by name and key input or output readings.
- Open a device detail view when a summary needs more context.
Shape custom dashboards for a room, device, or task
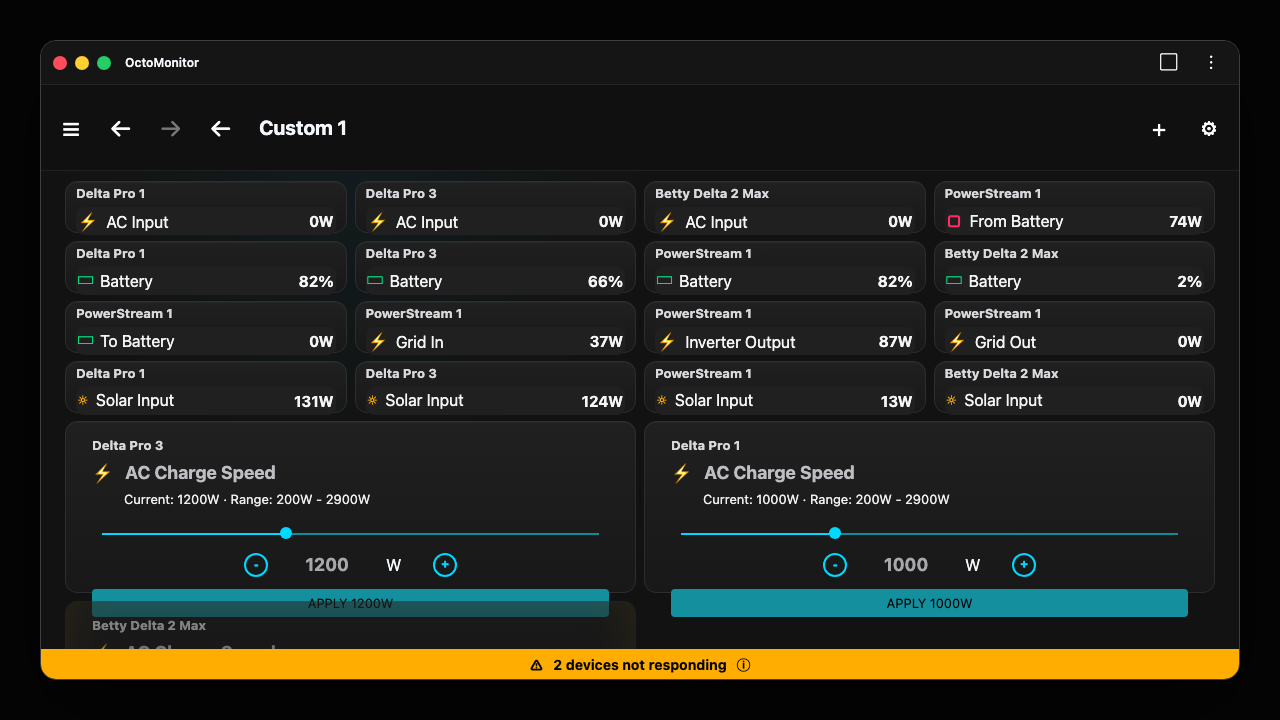
Custom dashboard pages let you choose the individual settings and readings that belong together. Battery, solar, socket, input, output, and supported control widgets can be added, moved, resized, or made compact.
That flexibility makes it possible to build a simple wall display, a control panel for one device, or a broader energy overview. The goal is not to show every available value; it is to keep the values that support a decision visible and readable.
- Add read-only telemetry and supported writable controls.
- Drag and resize widgets on the dashboard grid.
- Use compact display options when several readings must share a smaller screen.
- Save focused pages instead of overloading a single universal dashboard.
Extend the dashboard across windows and screen sizes
OctoMonitor pages can be opened in separate browser windows, allowing device detail, telemetry charts, and reports to remain visible at the same time. On a desktop, those windows can be arranged across more than one monitor; on a phone or tablet, each page remains a focused touch-friendly view.
The dashboard is part of a wider monitoring workflow. When a live value looks unusual, open its history or a report rather than guessing from one moment. For vendor setup, firmware, account management, and unsupported controls, return to the official EcoFlow app.
- Keep live device state on one screen and historical evidence on another.
- Use responsive grid, list, detail, and widget layouts across phone, tablet, and desktop.
- Open reports and charts beside the dashboard for faster comparison.
- Keep official EcoFlow tools available for vendor-specific administration.