Turn changing device readings into usable history
OctoMonitor can retain MQTT telemetry in local storage while the monitoring environment is able to receive it. Live and historical tables expose device, time, date, note, and sort filters, along with filtered and total record counts.
Local storage keeps OctoMonitor from adding another hosted telemetry service, but it also changes the operating model. History depends on the browser or installed app environment, its available storage, connectivity, and whether monitoring remains active.
- Pause and resume the live feed when you need to inspect a stable view.
- Filter historical rows by device and time range.
- Add notes that make a later event easier to interpret.
- Review stale-data guidance when expected telemetry stops arriving.
Move from raw telemetry to charts and reports
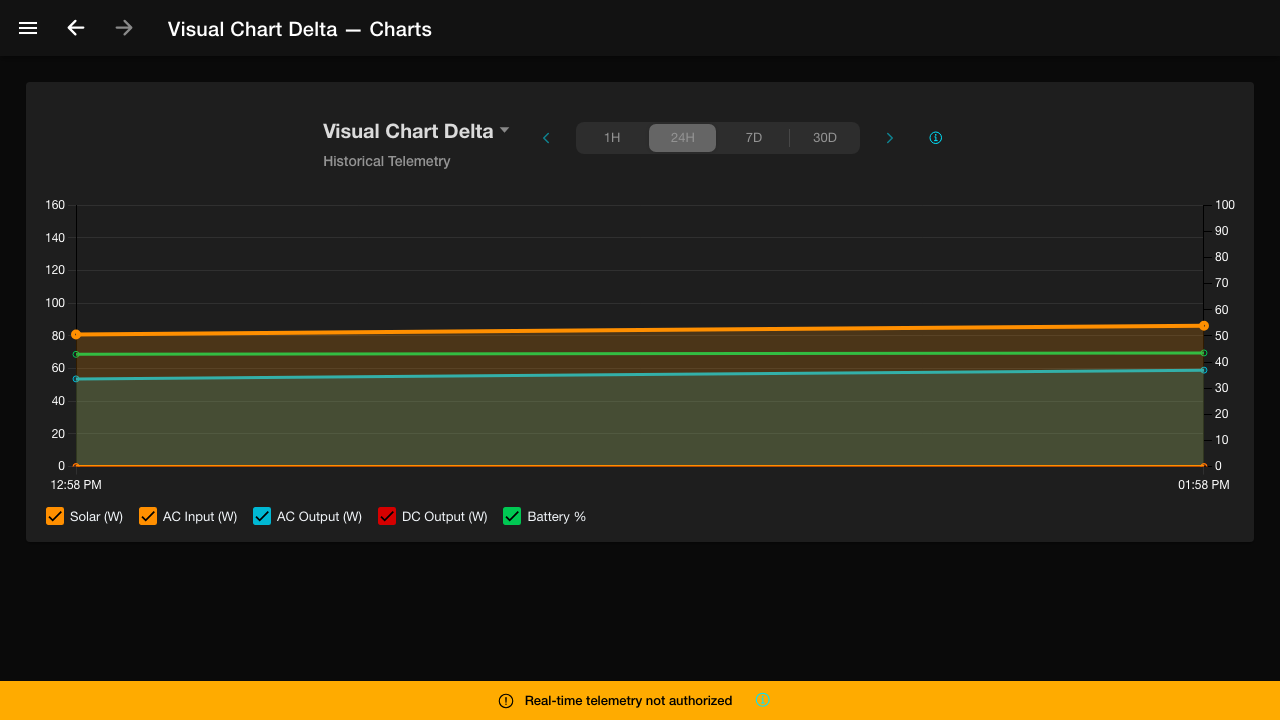
Charts provide common 1-hour, 24-hour, 7-day, and 30-day ranges with selectable metrics. Multiple supported devices can be compared on the same chart, helping show whether a change belongs to one device or reflects a broader household energy pattern.
Reports organise telemetry into solar generation, energy and power, battery storage, connectivity, command, fault, and audit views. Chart and table modes provide different levels of detail depending on whether you are looking for a pattern or an exact record.
- Compare solar input, battery, and power metrics over useful time ranges.
- Review daily solar yield, peak generation hours, and solar-versus-grid splits.
- Inspect connectivity reliability, telemetry gaps, coverage, and fault timelines.
- Use table views when the individual readings behind a chart matter.
Understand the limits before relying on historical data
No local monitoring history is complete if the app cannot receive data. Network interruptions, browser suspension, credentials, device availability, and storage limits can all create gaps. OctoMonitor surfaces stale and coverage information so missing data is not mistaken for zero usage or zero generation.
OctoMonitor is a monitoring companion rather than an official archive. Export or back up important data according to your own retention needs, keep credentials private, and use the official EcoFlow app for firmware, account, device setup, and vendor-specific diagnostics.
- Check coverage and gap diagnostics before drawing conclusions from a report.
- Keep the monitoring environment online when continuous history matters.
- Back up or export information that you need to retain beyond local storage.
- Validate important readings against the device and official EcoFlow tools.